Product Context
The business relied on manual sales forecasts based on historical averages and intuition.
These forecasts had a Mean Absolute Percentage Error (MAPE) of 14.1%, leading to chronic issues:
Over-forecasting caused excess inventory and wasted resources.
Under-forecasting led to stockouts and missed revenue.
The operations team needed reliable, automated forecasts across multiple product lines and regions
to enable proactive planning rather than reactive adjustments.
Data & Pipeline Design
Designed a modular forecasting pipeline that ingests historical sales data, applies preprocessing and feature extraction, and produces forecasts at daily/weekly/monthly granularity.
PostgreSQL
Cleaning + aggregation
Temporal features
Ensemble forecast
Time-series predictions
Looker Studio
Modeling Approach
Evaluated multiple time-series models and built an ensemble approach combining statistical methods (ARIMA/SARIMA) with Facebook Prophet for capturing trend, seasonality, and holiday effects.
Forecast Dashboard
The forecast outputs are visualized in a Looker Studio dashboard showing actual vs. predicted trends, forecast confidence intervals, and error tracking by product line and region.
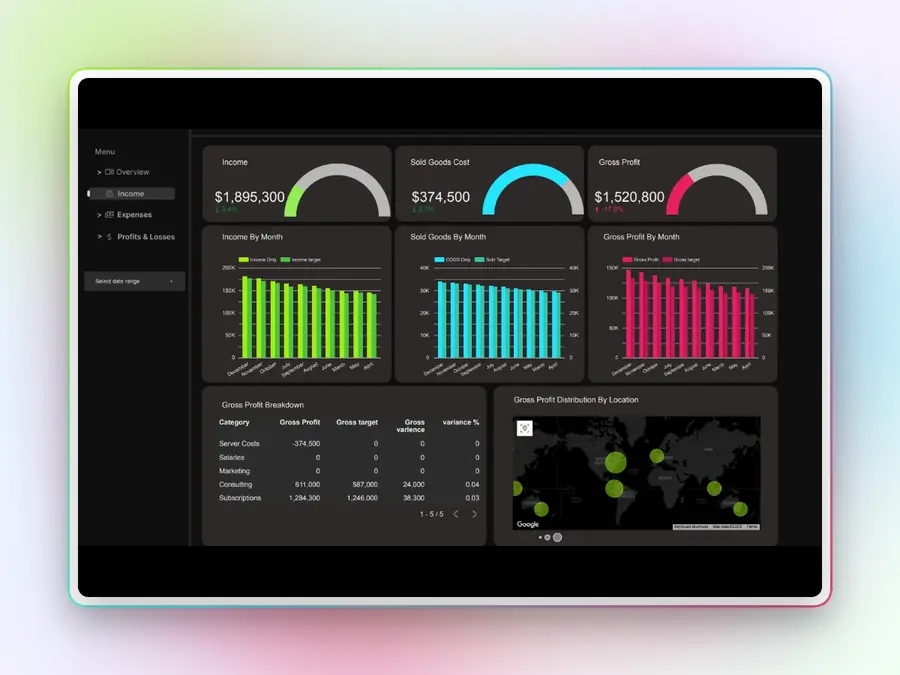
Interactive Dashboard
This dashboard provides a clear view of revenue, costs, and profit trends over time. It supports financial decision-making by highlighting performance changes, category breakdowns, and geographic distribution.
Key Findings
- Weekly seasonality was the strongest signal — Monday/Tuesday consistently under-indexed while Thursday/Friday peaked
- Prophet's holiday component captured promotion-driven spikes that ARIMA alone couldn't model
- The ensemble approach reduced error most in volatile product lines where single models diverged significantly
- Forecast accuracy degraded beyond 14 days — operational planning was redesigned around 7-day rolling forecasts
How forecasts drove action
The forecasting engine became the input layer for operations planning.
Inventory was pre-positioned based on 7-day rolling forecasts. Staff scheduling aligned with predicted demand peaks.
Marketing promotions were timed around forecast valleys to smooth demand curves.
The key shift: from "what happened last month" to "what will happen this week" as the basis for resource decisions.